
Alternatives to cState
cState is a static status page generator for hyperfast Hugo. It features a clean design, minimal JavaScript, super light HTML/CSS, high customization options, optional admin panel, and read-only API. Best used with Netlify and Docker for optimal performance. Find open source and proprietary alternatives that serve similar purposes.
Self-hosted alternatives to cState
Open source projects that can replace cState:
Uptime Kuma
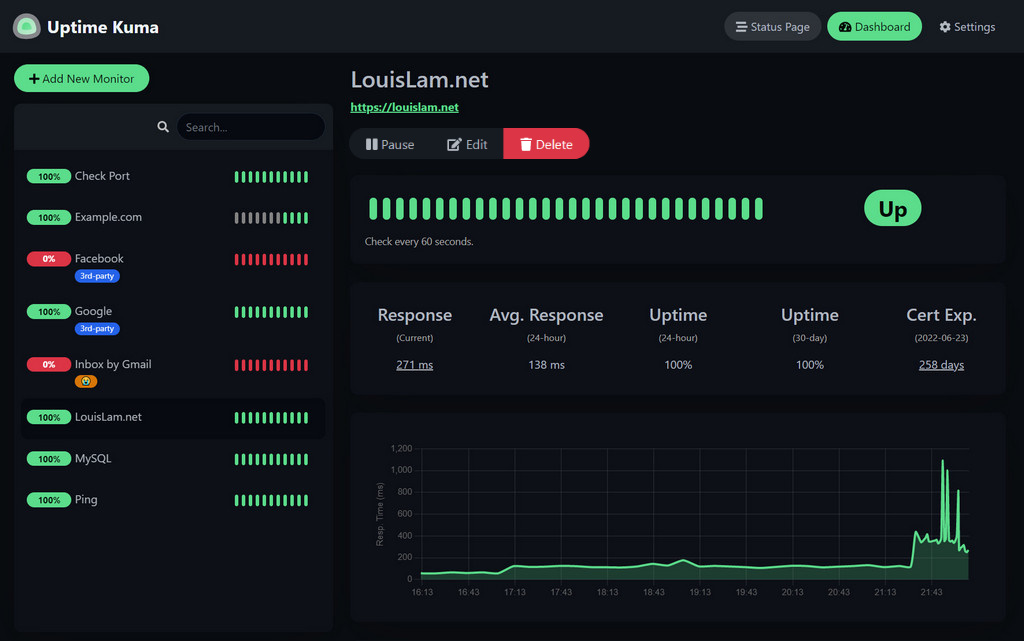
Uptime Kuma is a popular self-hosted monitoring tool that provides comprehensive website and service monitoring capabilities. Inspired by Uptime Robot, it offers a beautiful web interface, extensive notification options, and powerful status page features, making it an excellent choice for individuals and teams who need reliable uptime monitoring.
Key Features
-
Comprehensive Monitoring:
- HTTP/HTTPS website monitoring
- TCP port connectivity checks
- ICMP ping monitoring
- DNS resolution monitoring
- SSL certificate expiration tracking
- Custom monitoring intervals and timeouts
-
Extensive Notifications:
- 90+ notification services supported
- Email, SMS, and push notifications
- Slack, Discord, Telegram integration
- Microsoft Teams, Mattermost support
- Custom webhook notifications
- Multiple notification channels per monitor
-
Beautiful Status Pages:
- Public status pages for services
- Custom branding and themes
- Multi-language support
- Responsive mobile design
- Real-time status updates
- Incident timeline display
-
User Management:
- Multi-user support with permissions
- Two-factor authentication (2FA)
- User roles and access control
- Team collaboration features
- Secure authentication system
- Session management
-
Analytics & Reporting:
- Response time charts and graphs
- Uptime percentage calculations
- Historical data retention
- Performance trend analysis
- Data export capabilities
- Custom reporting periods
-
Advanced Features:
- Maintenance mode scheduling
- Incident management system
- API access for automation
- Backup and restore functionality
- Auto-update capabilities
- Custom certificate monitoring
-
Easy Deployment:
- Simple Docker installation
- Web-based initial setup
- Minimal configuration required
- Built-in SQLite database
- Automatic migrations
- Cross-platform compatibility
Technical Specifications
- Runtime: Node.js
- Database: SQLite (built-in)
- Frontend: Vue.js web interface
- API: RESTful HTTP API
- Deployment: Docker, npm
- License: MIT
- Platforms: Linux, macOS, Windows
Use Cases
- Website Monitoring: Continuous monitoring of website availability and performance
- Service Health Checks: Monitoring of APIs, databases, and other services
- Infrastructure Monitoring: Server and network service monitoring
- Team Collaboration: Shared monitoring dashboards for development teams
- Public Status Pages: Customer-facing service status communication
- Personal Projects: Individual website and service monitoring
Unique Advantages
- User-Friendly: Intuitive web interface with easy setup and configuration
- Extensive Integrations: 90+ notification services for comprehensive alerting
- Active Development: Regularly updated with new features and improvements
- Community Driven: Large, active community with extensive documentation
- All-in-One: Complete monitoring solution with status pages included
- Self-Contained: Single Docker container with built-in database
Based on the Uptime Kuma GitHub repository, this tool has become one of the most popular self-hosted monitoring solutions due to its ease of use, comprehensive feature set, and active community development, making it perfect for both beginners and experienced users who need reliable uptime monitoring.
Gatus
Gatus is a powerful automated service health dashboard that continuously monitors your applications and services, providing real-time status updates and beautiful public status pages. Built with Go for performance and reliability, Gatus offers comprehensive monitoring capabilities with flexible alerting and an intuitive web interface.
Key Features
-
Comprehensive Monitoring:
- HTTP/HTTPS endpoint monitoring
- TCP port connectivity checks
- DNS resolution monitoring
- SSL certificate expiration tracking
- Response time measurements
- Custom health check conditions
-
Advanced Health Checks:
- Response status code validation
- Response body content verification
- JSON path validation
- Performance threshold monitoring
- Custom condition scripting
- Multi-step health checks
-
Flexible Alerting:
- Multiple alert provider support
- Slack integration
- Discord notifications
- Email alert system
- Custom webhook alerts
- PagerDuty integration
- Telegram notifications
-
Status Dashboard:
- Real-time service status display
- Public status page
- Historical uptime data
- Incident timeline
- Service grouping and categorization
- Responsive web interface
-
Configuration Management:
- YAML-based configuration
- Environment variable support
- Hot configuration reloading
- Flexible monitoring intervals
- Custom endpoint grouping
- Template support
-
Performance & Reliability:
- Lightweight Go application
- Minimal resource usage
- High-performance monitoring
- Concurrent health checks
- Efficient data storage
- Fast response times
-
Deployment Options:
- Docker containerization
- Kubernetes deployment
- Binary distributions
- ARM architecture support
- Multi-platform compatibility
- Easy scaling options
Technical Specifications
- Language: Go
- Configuration: YAML files
- Storage: In-memory with persistence options
- Frontend: Web-based dashboard
- Deployment: Docker, Kubernetes, Binary
- License: Apache-2.0
- Platforms: Linux, macOS, Windows, ARM
Use Cases
- Service Monitoring: Continuous monitoring of web applications and APIs
- Infrastructure Health: Monitoring of databases, servers, and network services
- Public Status Pages: Customer-facing service status communication
- Internal Dashboards: Team visibility into service health
- SLA Monitoring: Tracking service level agreement compliance
- Incident Management: Early detection and alerting for service issues
Unique Advantages
- Zero Dependencies: Single binary with no external database requirements
- High Performance: Efficient Go implementation with minimal resource usage
- Flexible Configuration: Powerful YAML-based configuration system
- Real-time Updates: Live status updates without page refreshes
- Multi-Protocol Support: HTTP, TCP, DNS, and SSL monitoring capabilities
- Easy Deployment: Simple Docker deployment with Kubernetes support
Based on the Gatus GitHub repository, this tool provides a perfect balance of simplicity and power, making it ideal for teams that need reliable service monitoring with beautiful status pages and comprehensive alerting capabilities.

StatPing.ng
StatPing.ng is a comprehensive status page and monitoring solution that automatically monitors your websites and applications, providing beautiful status pages with extensive customization options. Built with Go for performance and reliability, it offers a complete monitoring solution with alerting, incident management, and detailed analytics.
Key Features
-
Comprehensive Monitoring:
- HTTP/HTTPS endpoint monitoring
- TCP port connectivity checks
- ICMP ping monitoring
- SSL certificate expiration tracking
- Response time measurements
- Custom monitoring intervals
-
Beautiful Status Pages:
- Modern, responsive design
- Real-time status updates
- Historical uptime data
- Performance charts and graphs
- Service grouping and categorization
- Custom branding and themes
-
Advanced Alerting:
- Email notification system
- Slack integration
- Discord alerts
- Custom webhook notifications
- SMS alerts (via providers)
- Multiple notification channels
-
Incident Management:
- Incident creation and tracking
- Status update management
- Maintenance mode scheduling
- Incident timeline
- Resolution tracking
- Post-incident analysis
-
Data & Analytics:
- Detailed uptime statistics
- Response time analytics
- Historical data retention
- Performance trending
- Export capabilities
- Custom reporting
-
Database Support:
- SQLite for simple deployments
- MySQL/MariaDB support
- PostgreSQL compatibility
- Data persistence and backup
- Migration tools
- Performance optimization
-
Customization & API:
- Custom theme support
- Branding customization
- RESTful API access
- Configuration management
- Plugin system
- Extensible architecture
Technical Specifications
- Language: Go
- Database: SQLite, MySQL, PostgreSQL
- Frontend: Web-based interface
- API: RESTful HTTP API
- Deployment: Docker, Binary
- License: GPL-3.0
- Platforms: Linux, macOS, Windows
Use Cases
- Website Monitoring: Continuous monitoring of website availability and performance
- Application Health: Monitoring of web applications and APIs
- Infrastructure Monitoring: Server and service health tracking
- Public Status Pages: Customer-facing service status communication
- Internal Dashboards: Team visibility into system health
- SLA Compliance: Service level agreement monitoring and reporting
Unique Advantages
- All-in-One Solution: Complete monitoring and status page solution in one package
- Beautiful Interface: Modern, customizable status page design
- Multiple Databases: Flexible database support for different deployment needs
- Rich Features: Comprehensive feature set including incident management
- Go Performance: High-performance monitoring with minimal resource usage
- Open Source: GPL-3.0 licensed with active community development
Based on the StatPing.ng GitHub repository, this tool provides a feature-rich monitoring and status page solution that combines powerful monitoring capabilities with beautiful, customizable status pages, making it ideal for organizations that need comprehensive uptime monitoring with professional status communication.
More status projects
Discover other open source projects in the status category:


Showing 1-3 of 3 projects in status